Sabbatical Project
Women and Inequality: A Macro/Micro Exploration Utilizing Information Design
The focus of this sabbatical project (Spring 2018) is data and information design. I began researching and reading books and reports, I became more and more focused on the inequality of women both on a global and national scale (timely of course). A friend recommended, Half the Sky by Nicholas Kristof and Sheryl WuDunn. I found the book stirring and compelling. I was drawn in by the stories of these women struggling for freedom and some semblance of control over their own bodies, educational and economic pursuits, and the ability to have a voice in their social and political worlds. I also found great sources of data and information from institutions such as the United Nations, World Economic Forum, U.S. Labor Department, Census Bureau and many others to support my investigations into this topic.
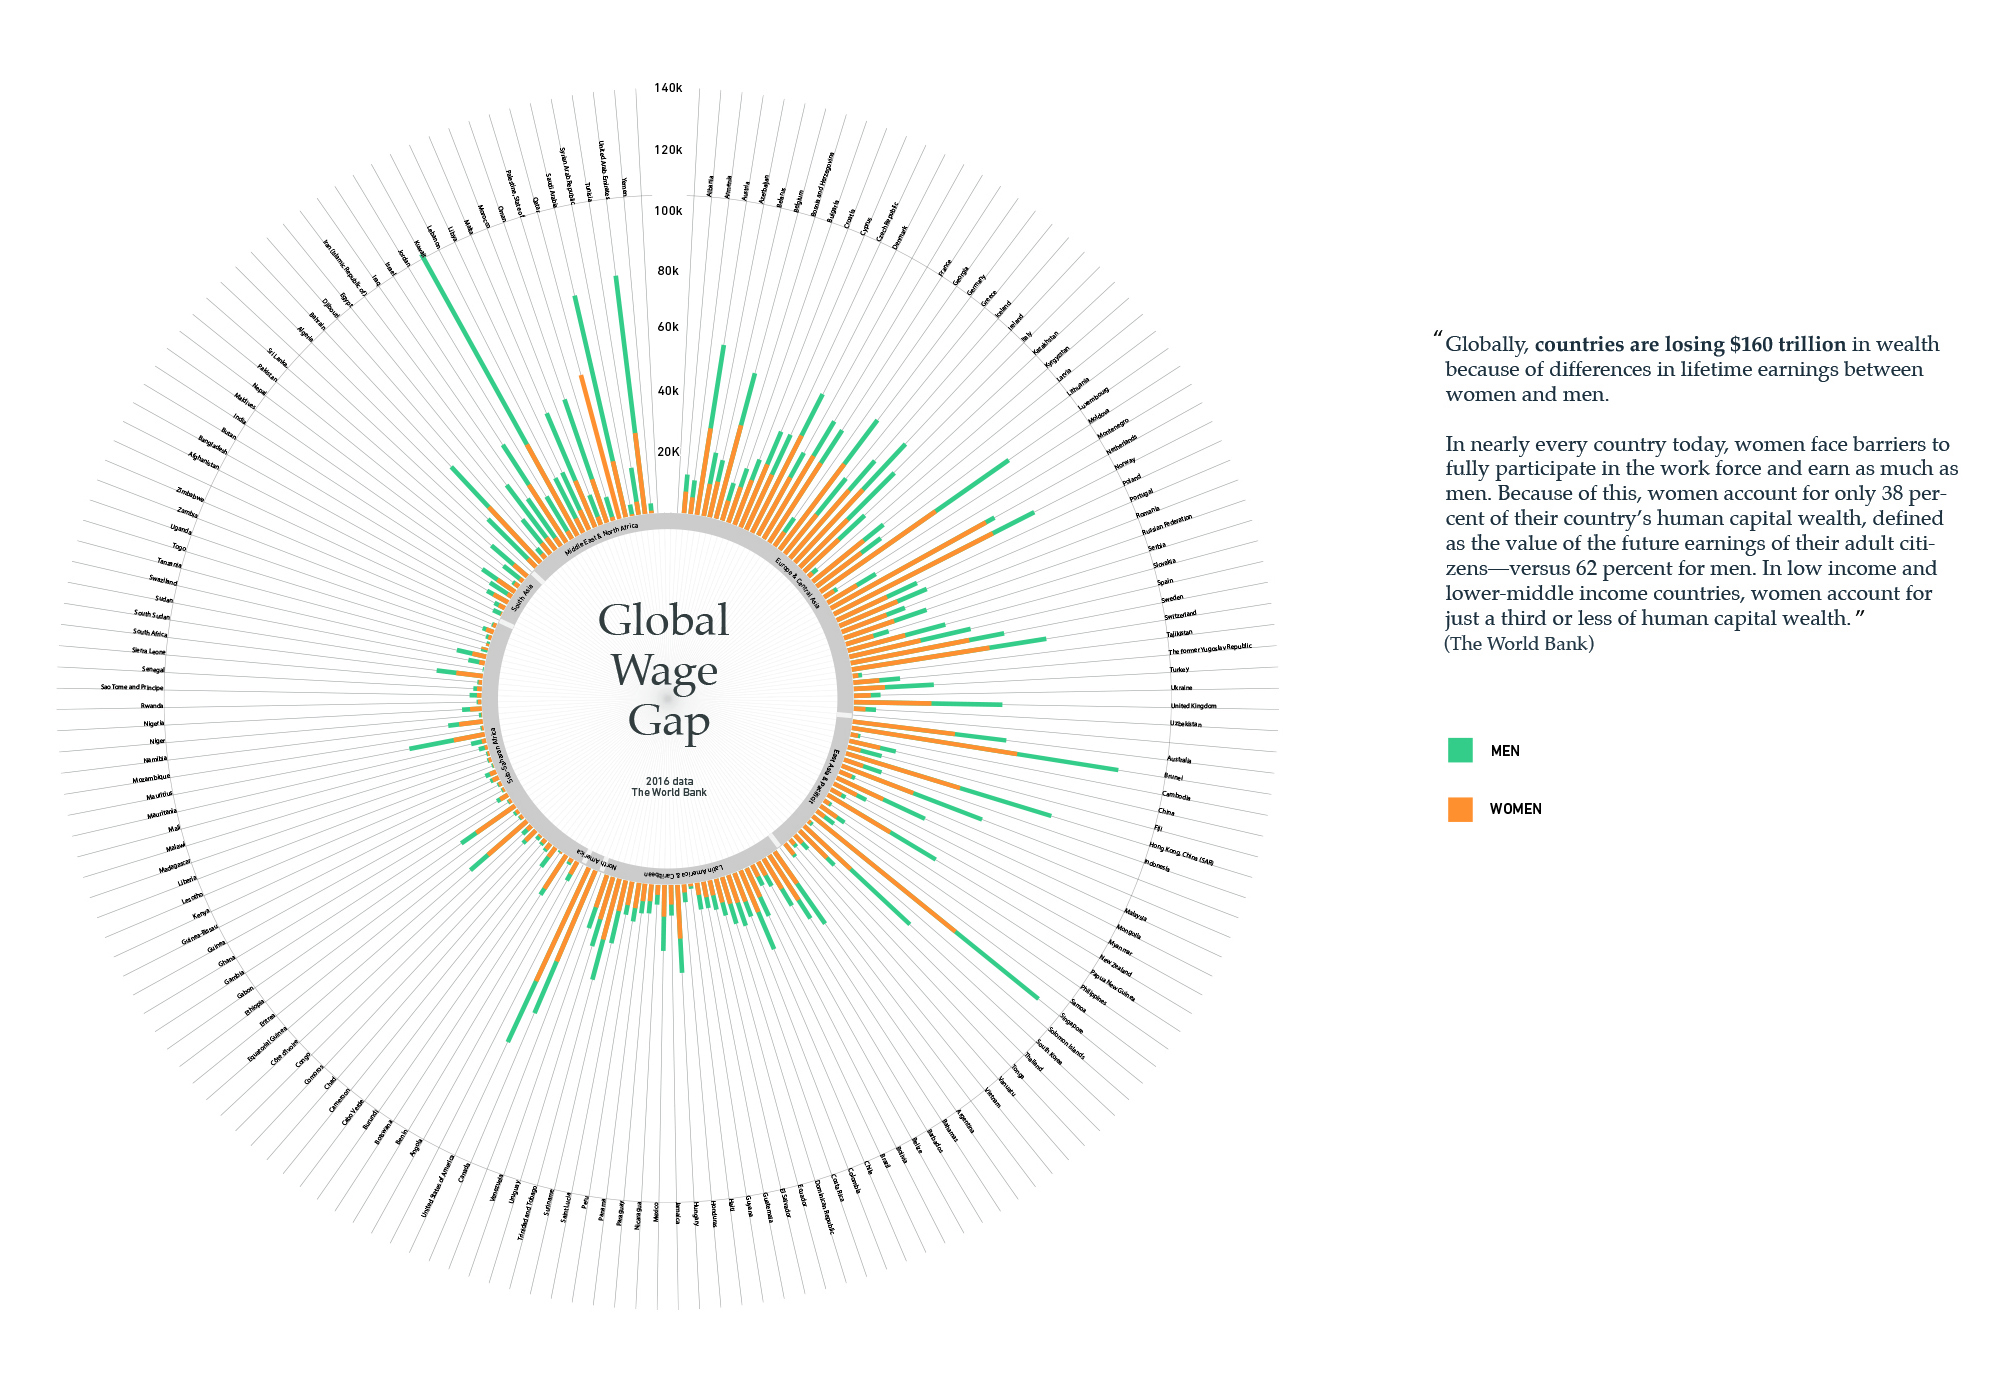
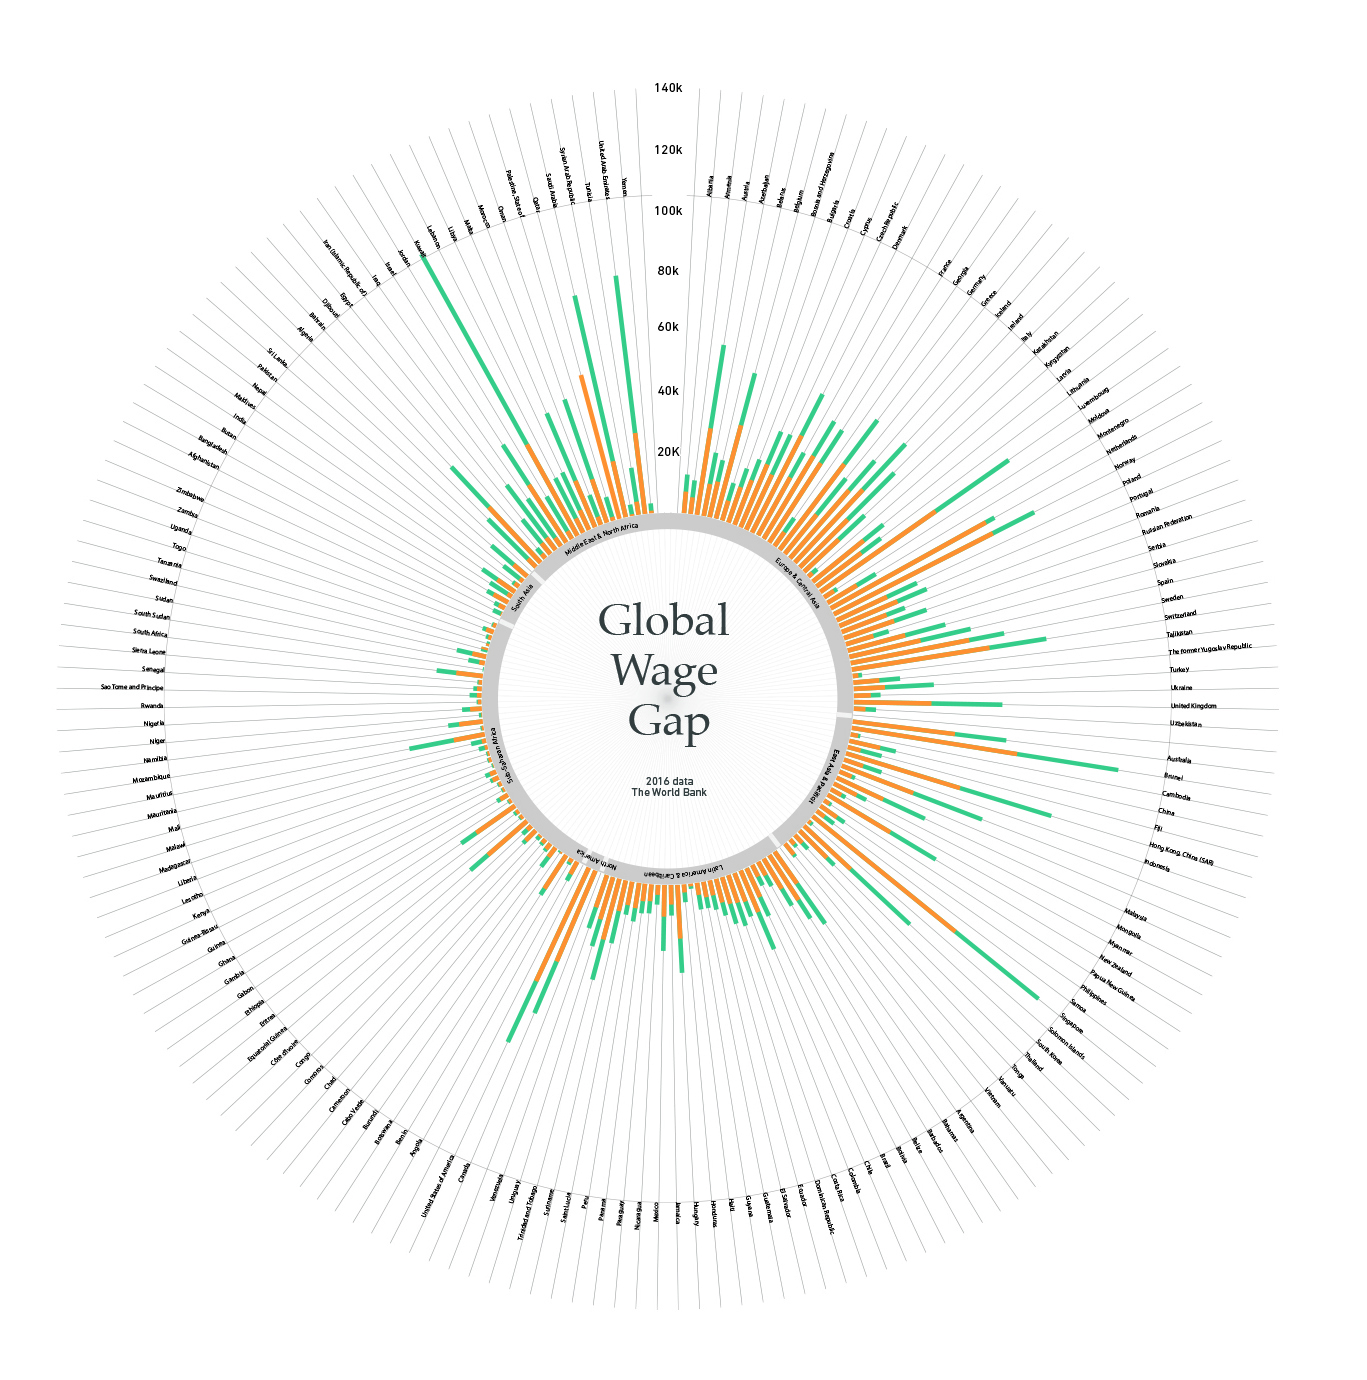
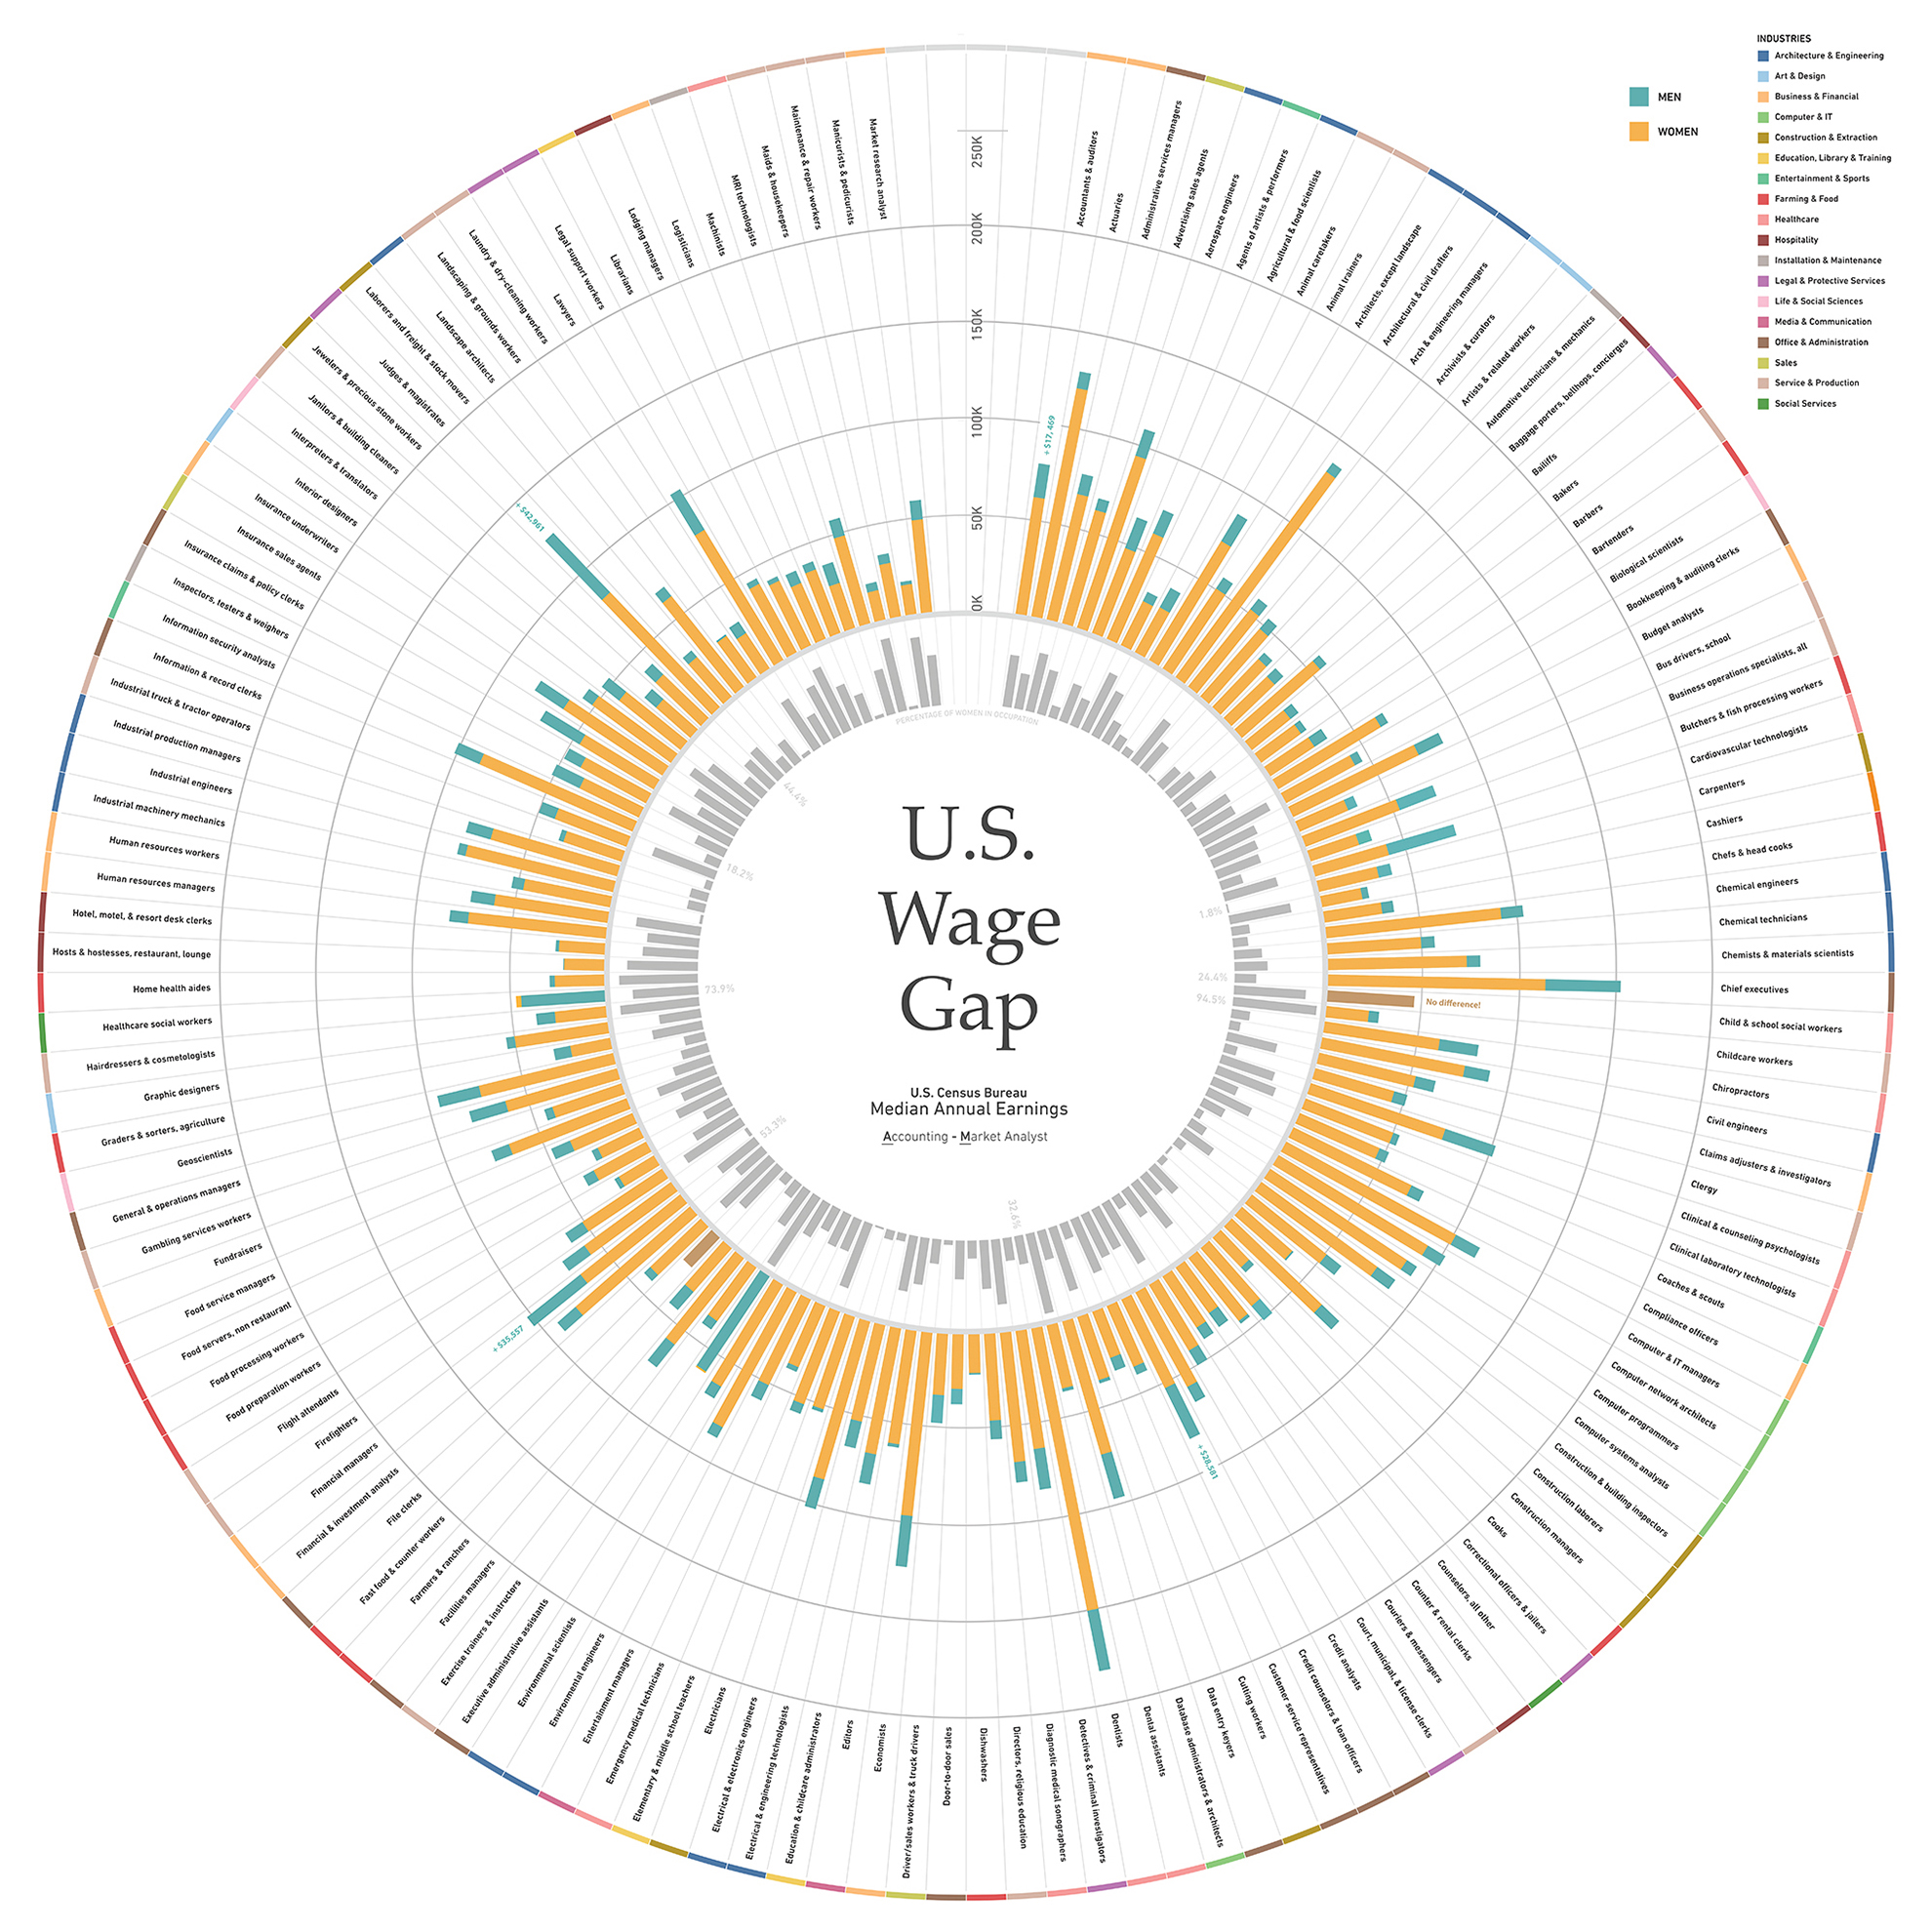
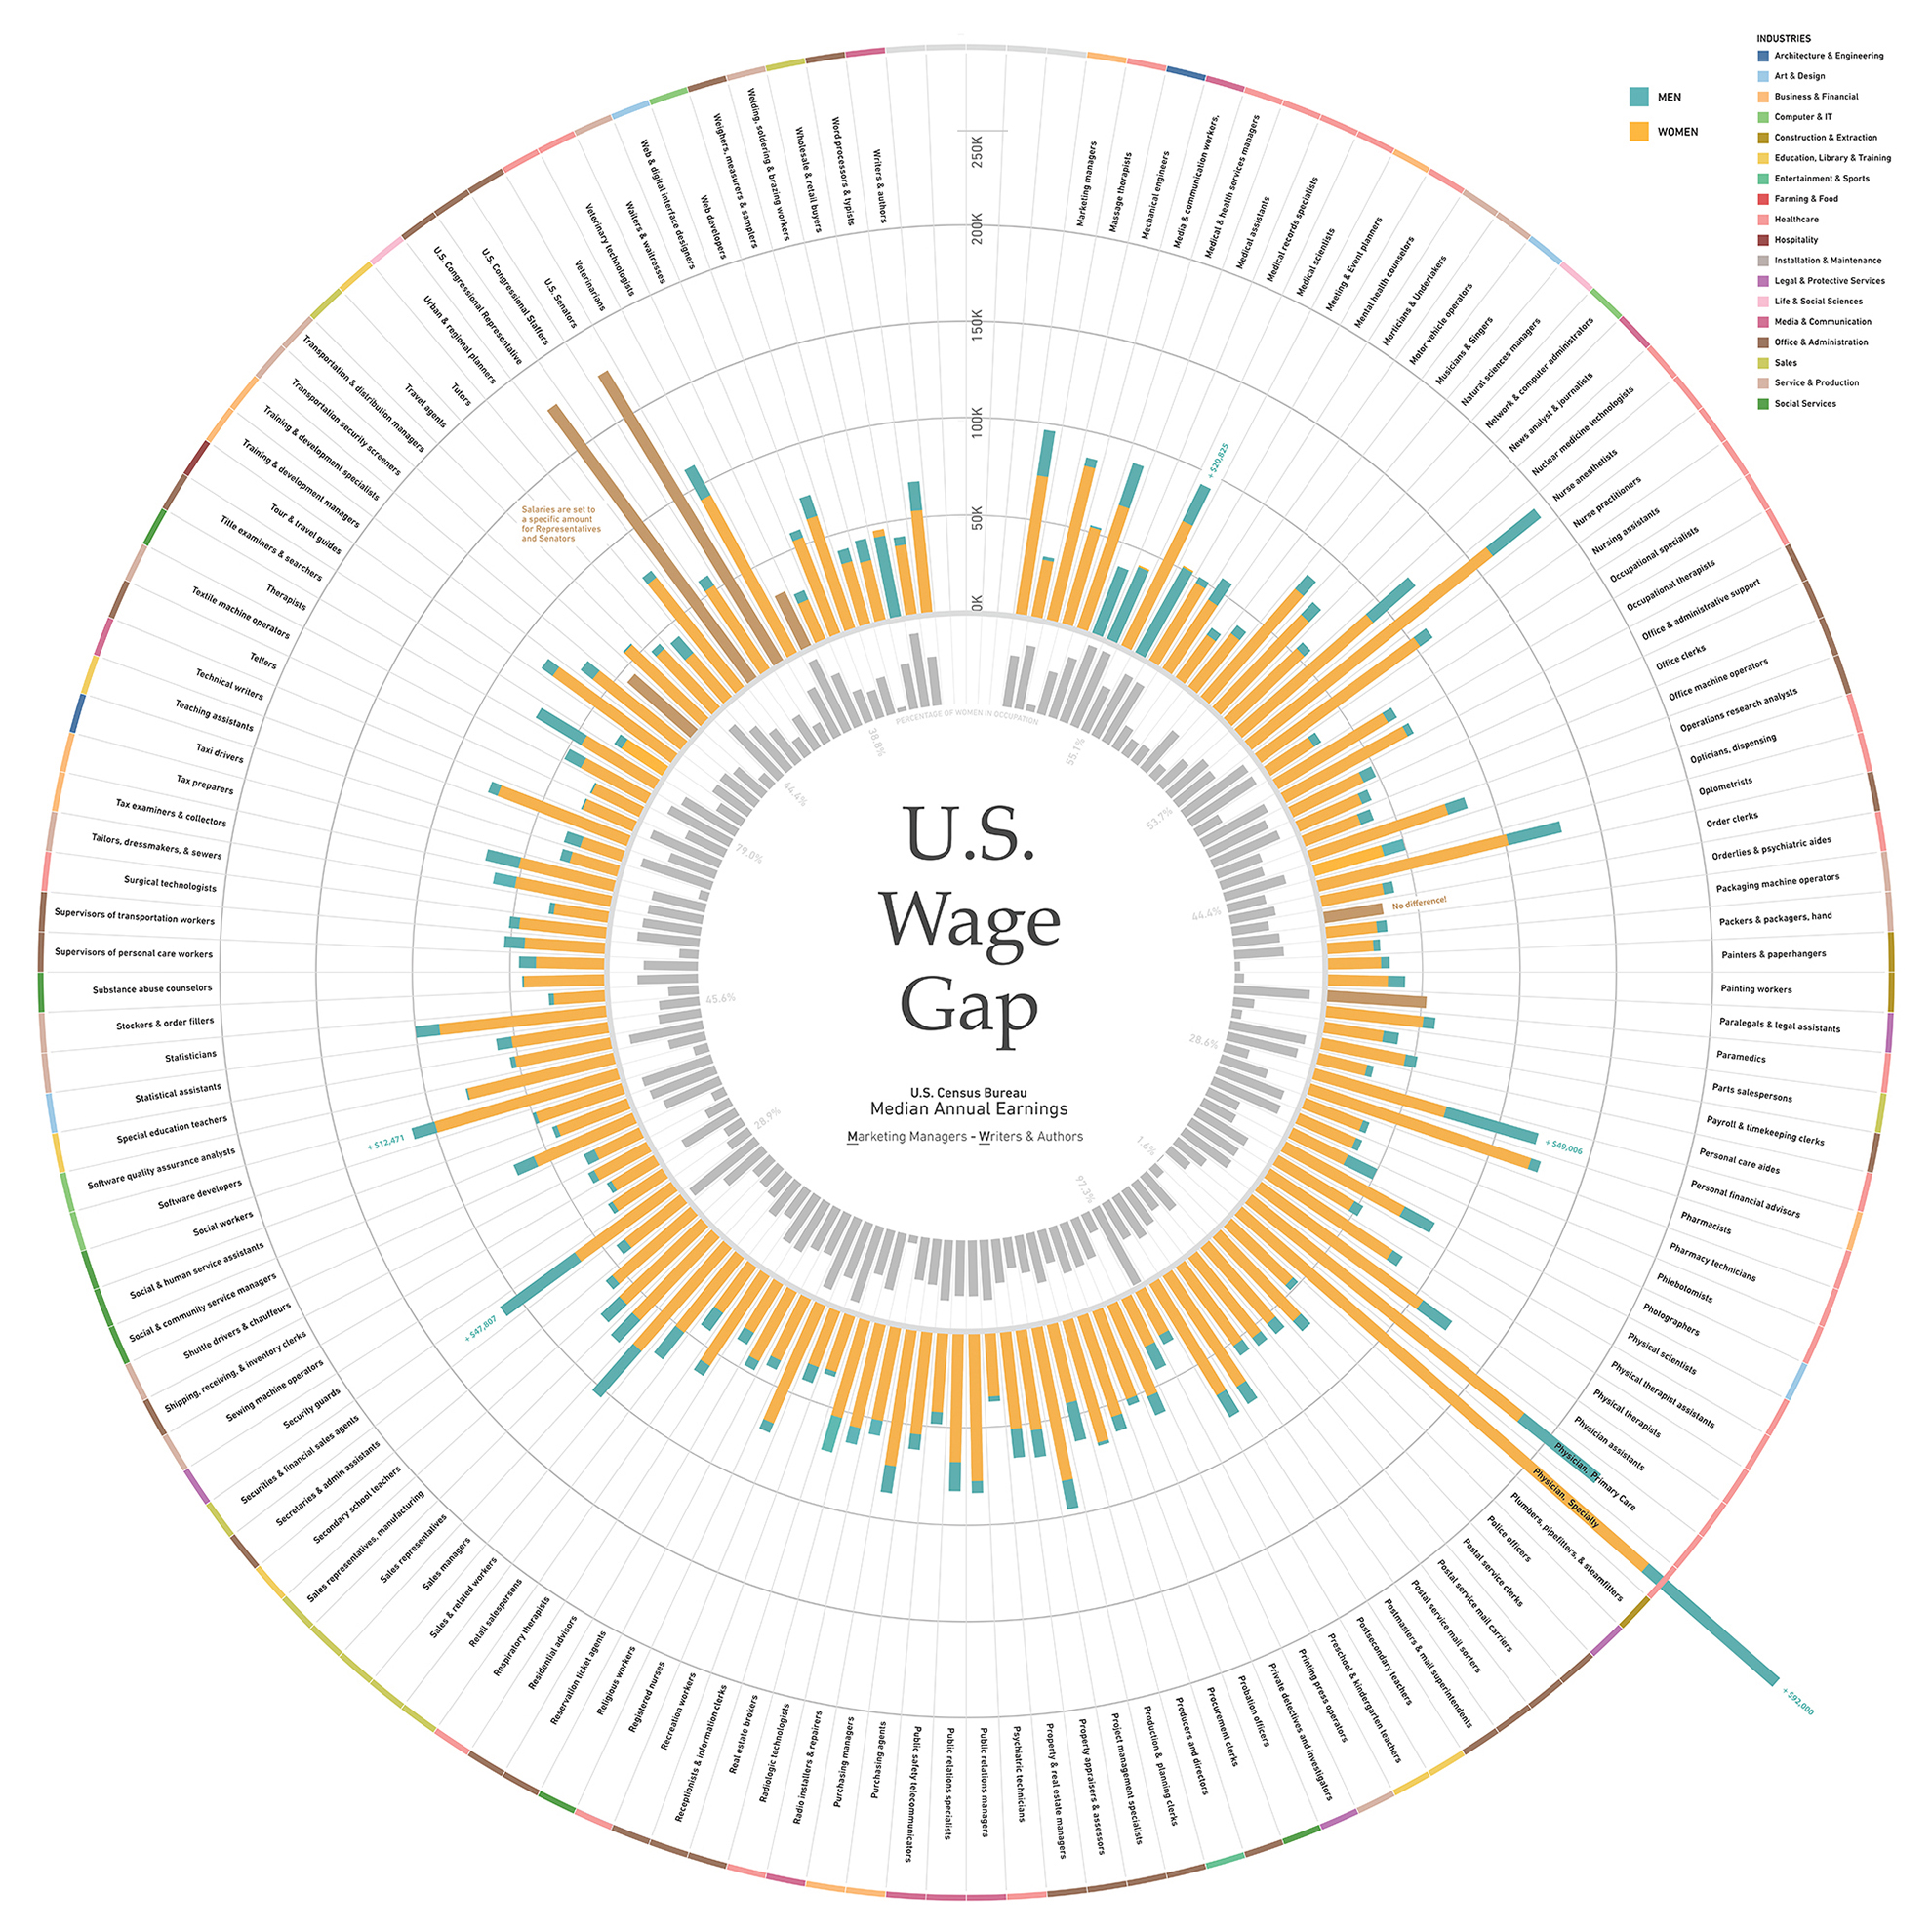
I looked at the factors that determine the health and wellbeing of women throughout the world as determined by notable reputable sources. I explored which countries are doing a better job at attempting to reach gender parity and why. I found the worst places for girls and women to live. I was also very interested in where the United States fell comparatively to other countries - especially our “peers” in developed nations. To this end I took a macro/micro approach juxtaposing where the U.S. stood on a global stage, and then more specifically at the data for dimensions and measure specific to the U.S. To that end, I looked at; percentage of women in government, female heads of state & industry, differences in gross national income between men and women, maternal mortality rates, adolescent birth rates, educational rates for men and women, sex trafficking and many others. I then looked at the specific data for these topics relevant to the U.S. - often focusing on state by state differences and by looking at differences based on gender and race (such as in the income gap).
Throughout this process I discovered the narrative I wanted to tell about women and their prospects in this world both on a global and national level. For example, illustrating where the U.S. falls in maternal mortality rates globally (worst of all the developed countries) and then which states have the worst MMR (Texas). I then looked to discover the “why” behind the data in order to provide context and understanding to the subject at hand.
During this process, I learned and utilized software and design principles to try and communicate clearly to a broad audience. My efforts involved the deliberate and effective communication of complex data through visual means. Much of the time spent was spent visualizing and designing information graphics including attention to typography, iconography and layout.